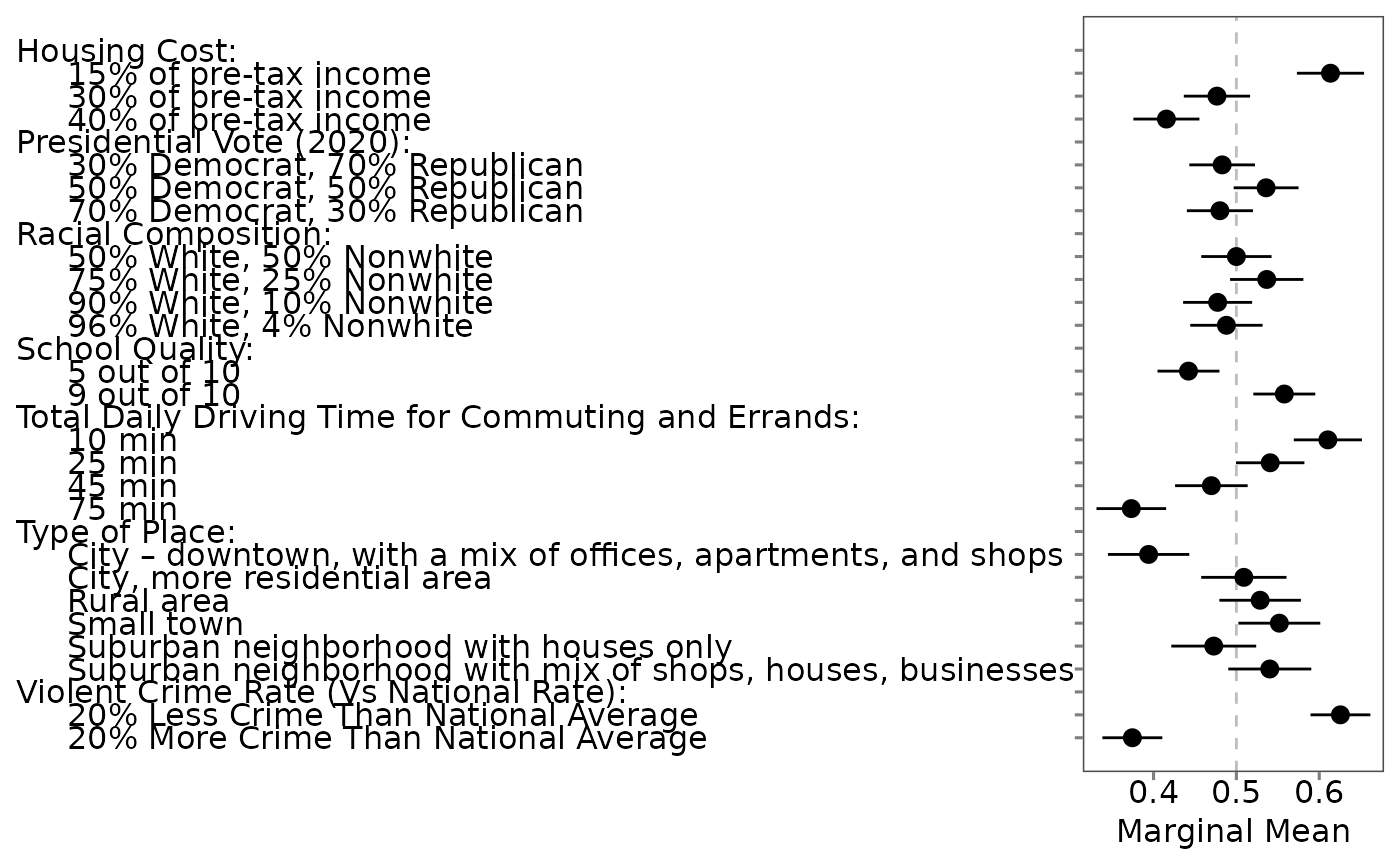
Plot all MMs or AMCEs
plot_projoint.RdThis function produces MM or AMCE plots given an output from the `projoint` function.
Usage
plot_projoint(
  .data,
  .estimand = "mm",
  .estimates = "corrected",
  .by_var = FALSE,
  .base_size = 12,
  .base_family = ""
)
Arguments
- .data
A `projoint_results_mm` or `projoint_results_amce` object
- .estimand
Either "mm" for marginal mean (default) or "amce" for average marginal component effect
- .estimates
The estimates to be plotted, either "corrected" (default), "uncorrected", or "both"
- .by_var
TRUE to plot the difference in estimates between the two subgroups, FALSE (default) otherwise
- .base_size
base font size, given in pts.
- .base_family
base font family
Examples
library(projoint)
data("exampleData1")
head(exampleData1)
#> # A tibble: 6 × 185
#> ResponseId choice1_repeated_fli…¹ choice1 choice2 choice3 choice4 choice5
#> <chr> <chr> <chr> <chr> <chr> <chr> <chr>
#> 1 R_1M3TDihZzq9z… Community B Commun… Commun… Commun… Commun… Commun…
#> 2 R_3HtXzkcSSlfi… Community B Commun… Commun… Commun… Commun… Commun…
#> 3 R_yjYj0jtOY98X… Community B Commun… Commun… Commun… Commun… Commun…
#> 4 R_1dKd05O6FTOV… Community B Commun… Commun… Commun… Commun… Commun…
#> 5 R_1otDp642wWYl… Community A Commun… Commun… Commun… Commun… Commun…
#> 6 R_2BnD3fuJMRKZ… Community A Commun… Commun… Commun… Commun… Commun…
#> # ℹ abbreviated name: ¹choice1_repeated_flipped
#> # ℹ 178 more variables: choice6 <chr>, choice7 <chr>, choice8 <chr>,
#> # race <chr>, party_1 <chr>, party_2 <chr>, party_3 <chr>, party_4 <chr>,
#> # ideology <chr>, honesty <chr>, `K-1-1` <chr>, `K-1-1-1` <chr>,
#> # `K-1-2` <chr>, `K-1-1-2` <chr>, `K-1-3` <chr>, `K-1-1-3` <chr>,
#> # `K-1-4` <chr>, `K-1-1-4` <chr>, `K-1-5` <chr>, `K-1-1-5` <chr>,
#> # `K-1-6` <chr>, `K-1-1-6` <chr>, `K-1-7` <chr>, `K-1-1-7` <chr>, …
outcomes <- paste0("choice", seq(from = 1, to = 8, by = 1))
outcomes <- c(outcomes, "choice1_repeated_flipped")
reshaped_data <- reshape_projoint(
.dataframe = exampleData1,
.idvar = "ResponseId",
.outcomes = outcomes,
.outcomes_ids = c("A", "B"),
.alphabet = "K",
.repeated = TRUE,
.flipped = TRUE)
projoint_output <- projoint(reshaped_data)
plot_projoint(projoint_output)
