Visualize Your Estimates
visualize.Rmd🎨 Visualize MMs or AMCEs
The projoint package provides ready-to-publish plotting tools for conjoint analysis results.
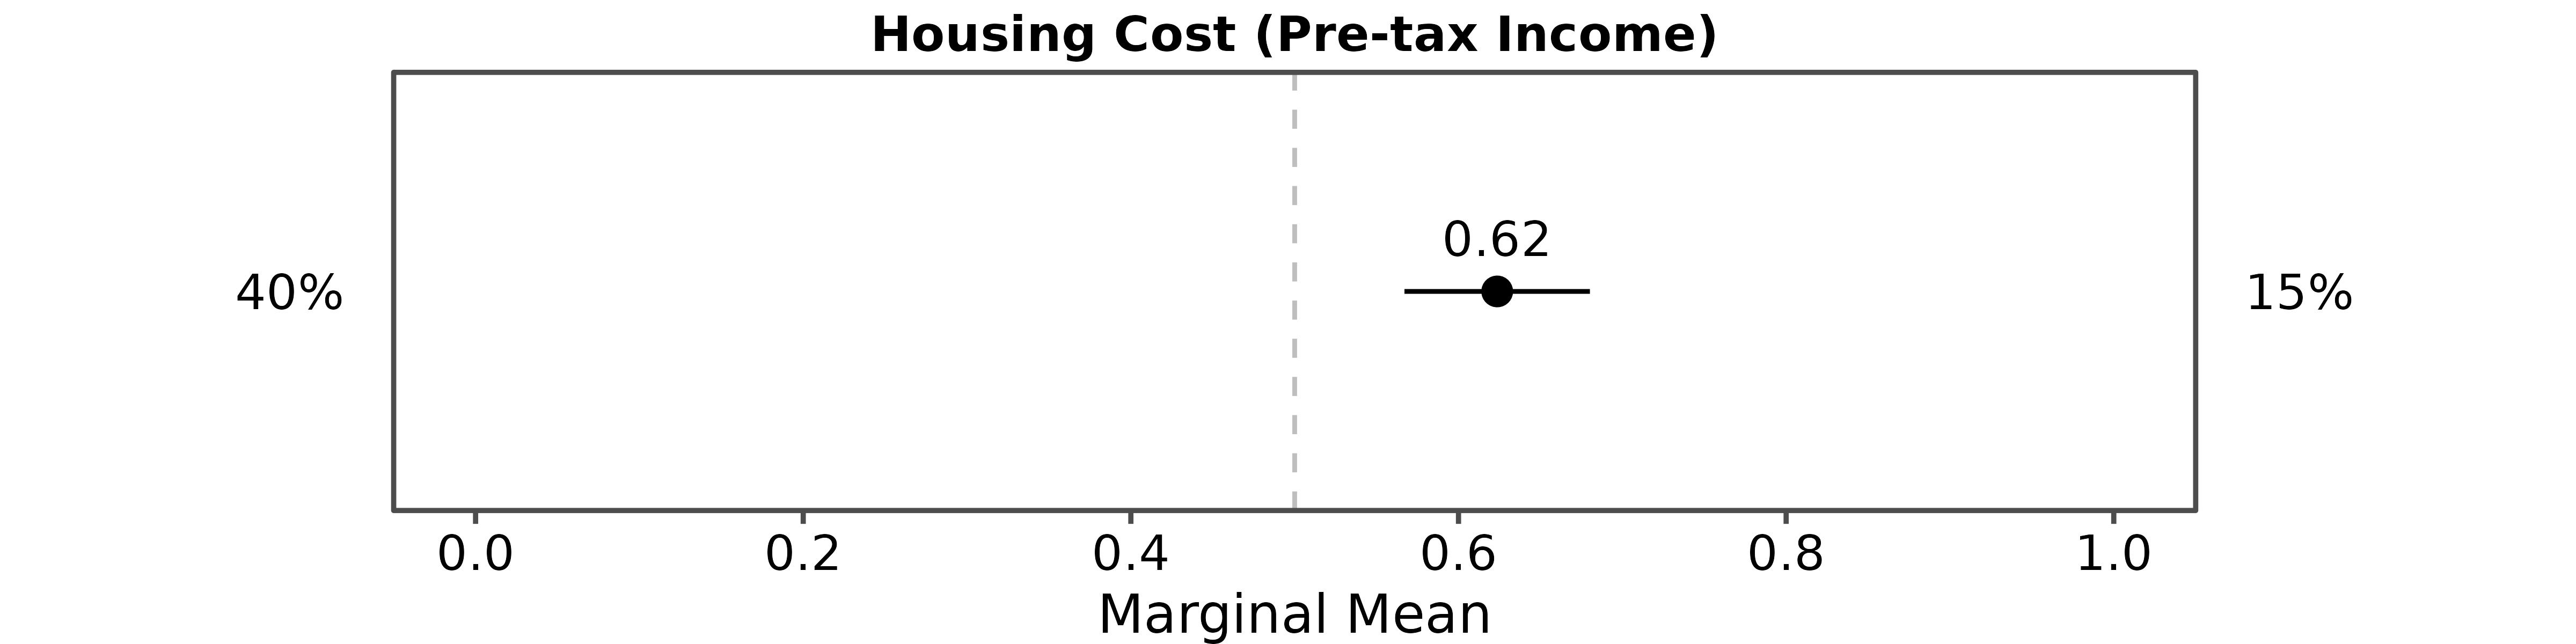
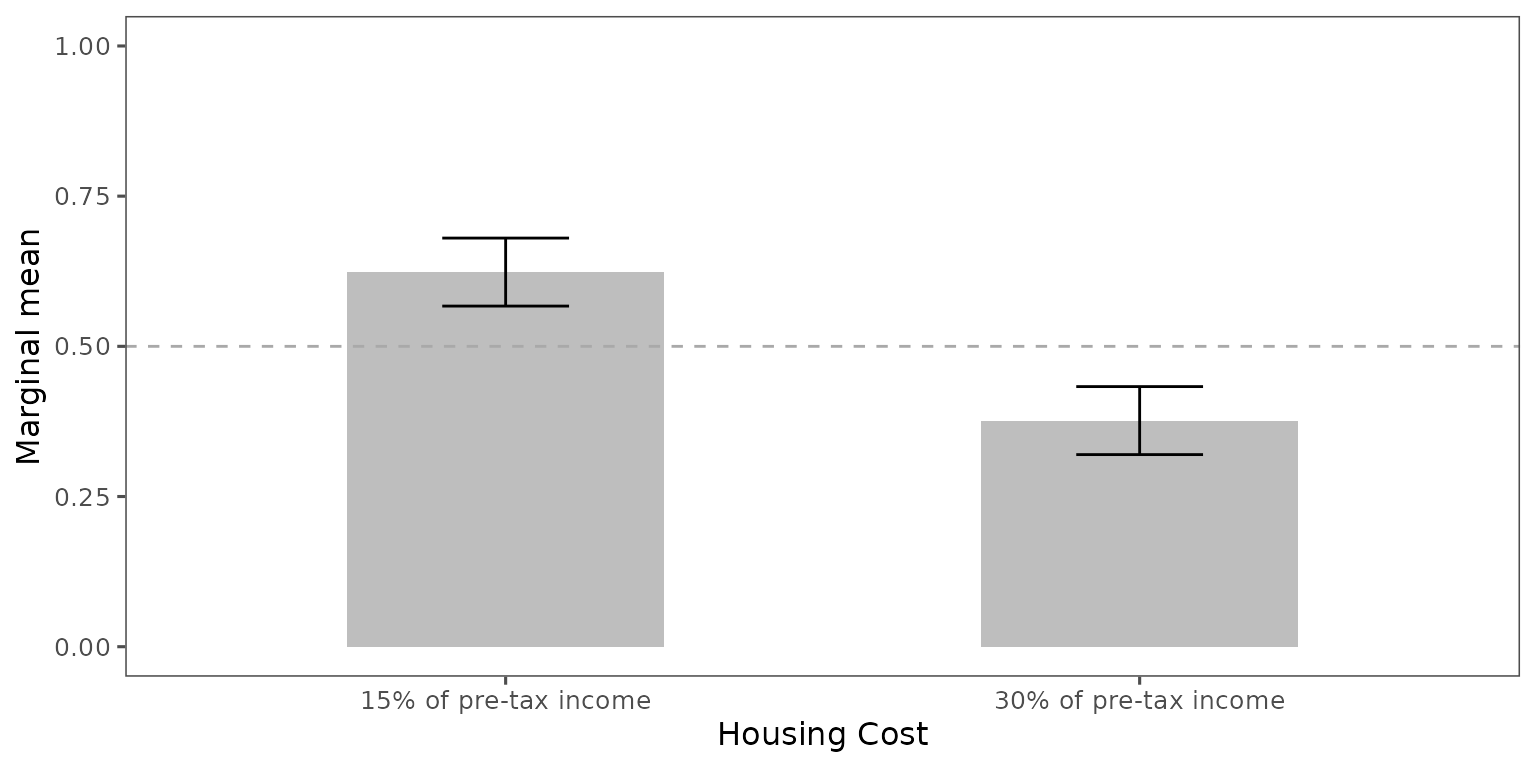
⚖️ Choice-Level Analysis
Estimate
- Specify your quantity of interest:
qoi_mm <- set_qoi(
  .structure = "choice_level", # default
  .att_choose = "att1",
  .lev_choose = "level1",
  .att_notchoose = "att1",
  .lev_notchoose = "level3"
)- Estimate
choice_mm <- projoint(
  .data = out1_arranged,
  .qoi = qoi_mm,
  .ignore_position = TRUE
)
Note: The current version
of projoint supports plotting choice-level MMs
only.
Support for choice-level AMCEs will be available in
future updates!
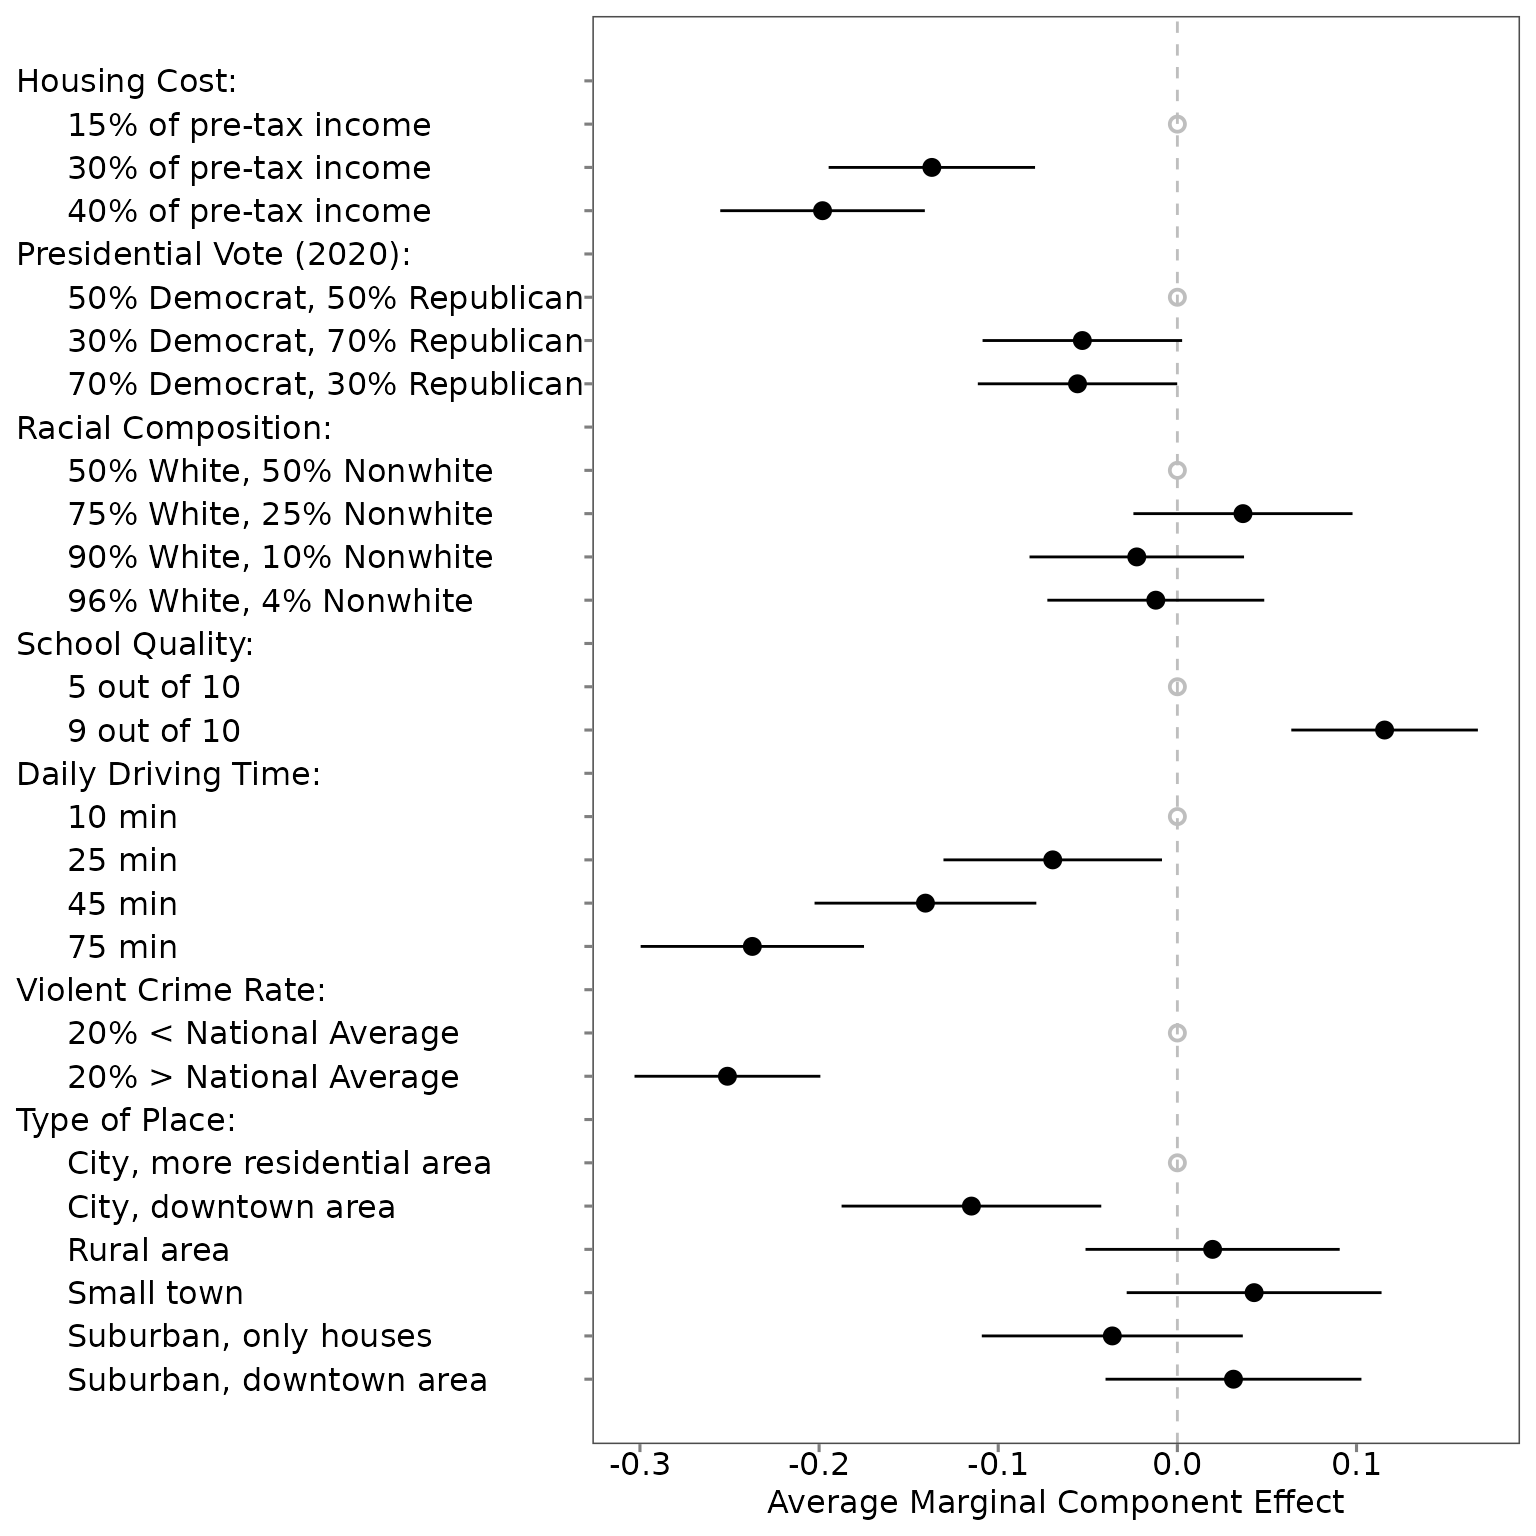
 - AMCEs
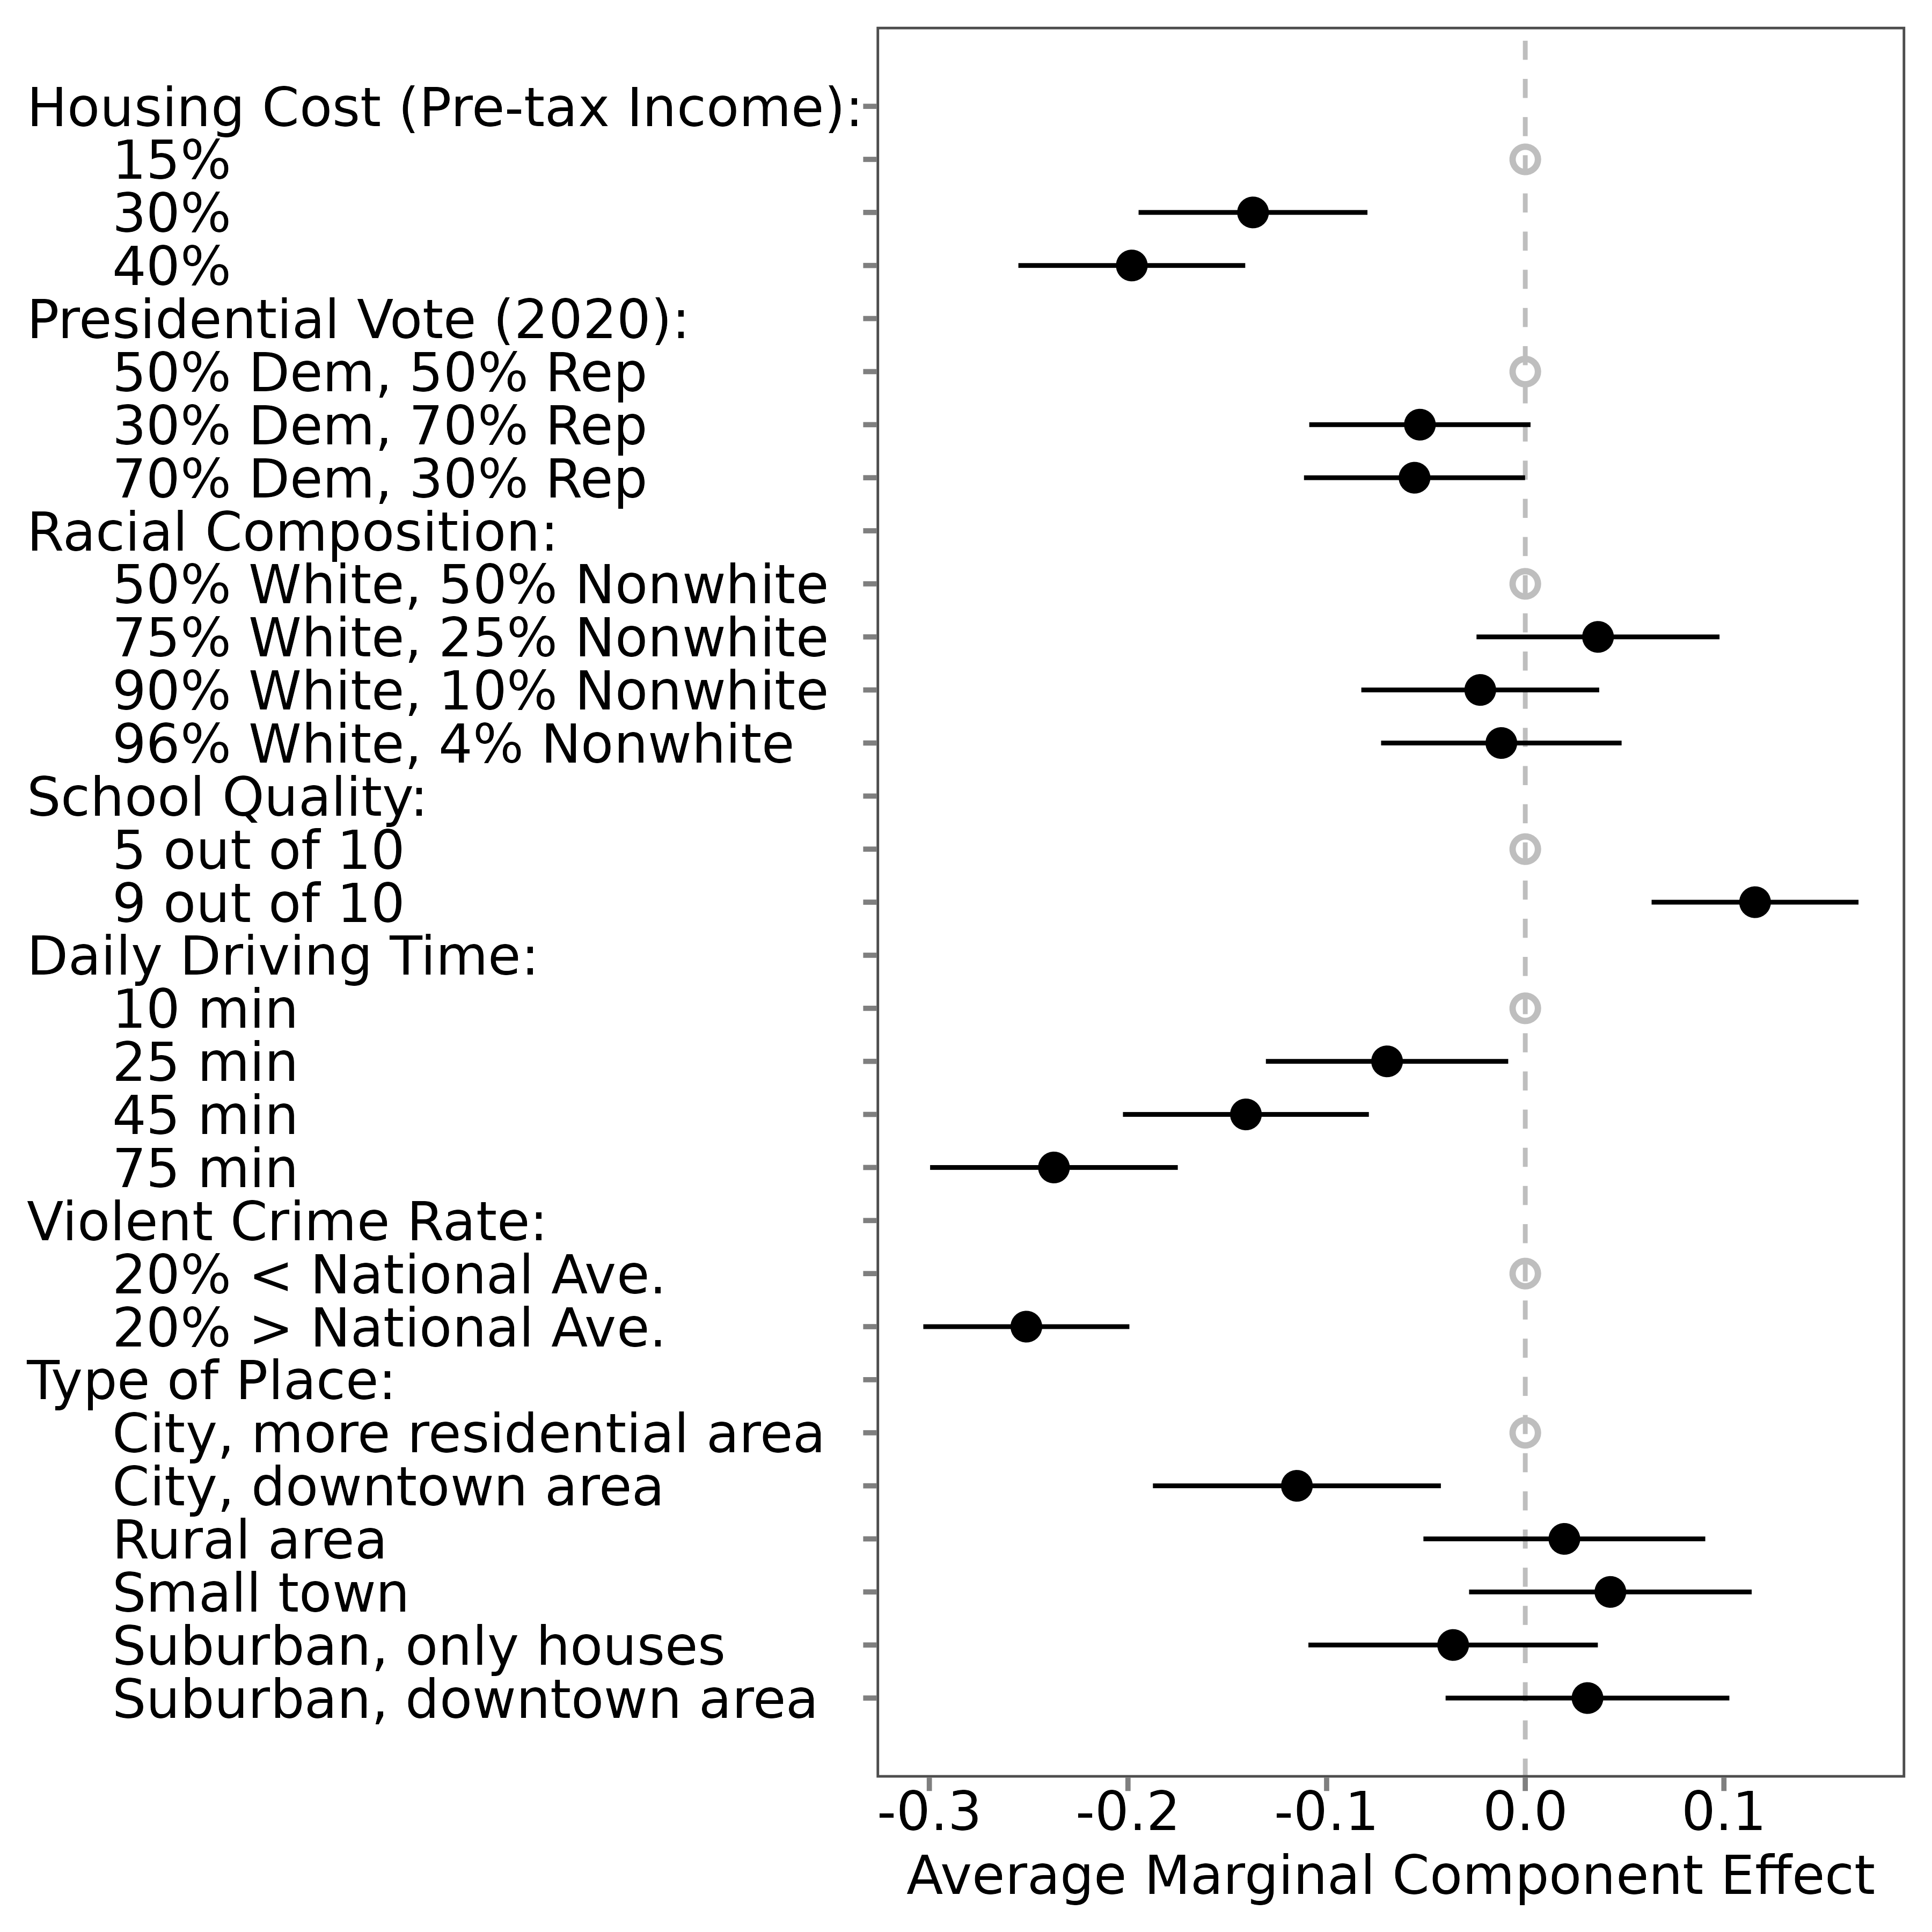
🌟 What’s Next?
Now that you can visualize your results, you’re ready to explore differences across subgroups and other additional analyses!
➡️ Continue to: Explore
Additional Analyses
⬅️ Back to: Analyze Your
Conjoint Data
🏠 Home: Home