Plot Prefectural Choropleth Maps
Source:vignettes/prefectural-choropleths.Rmd
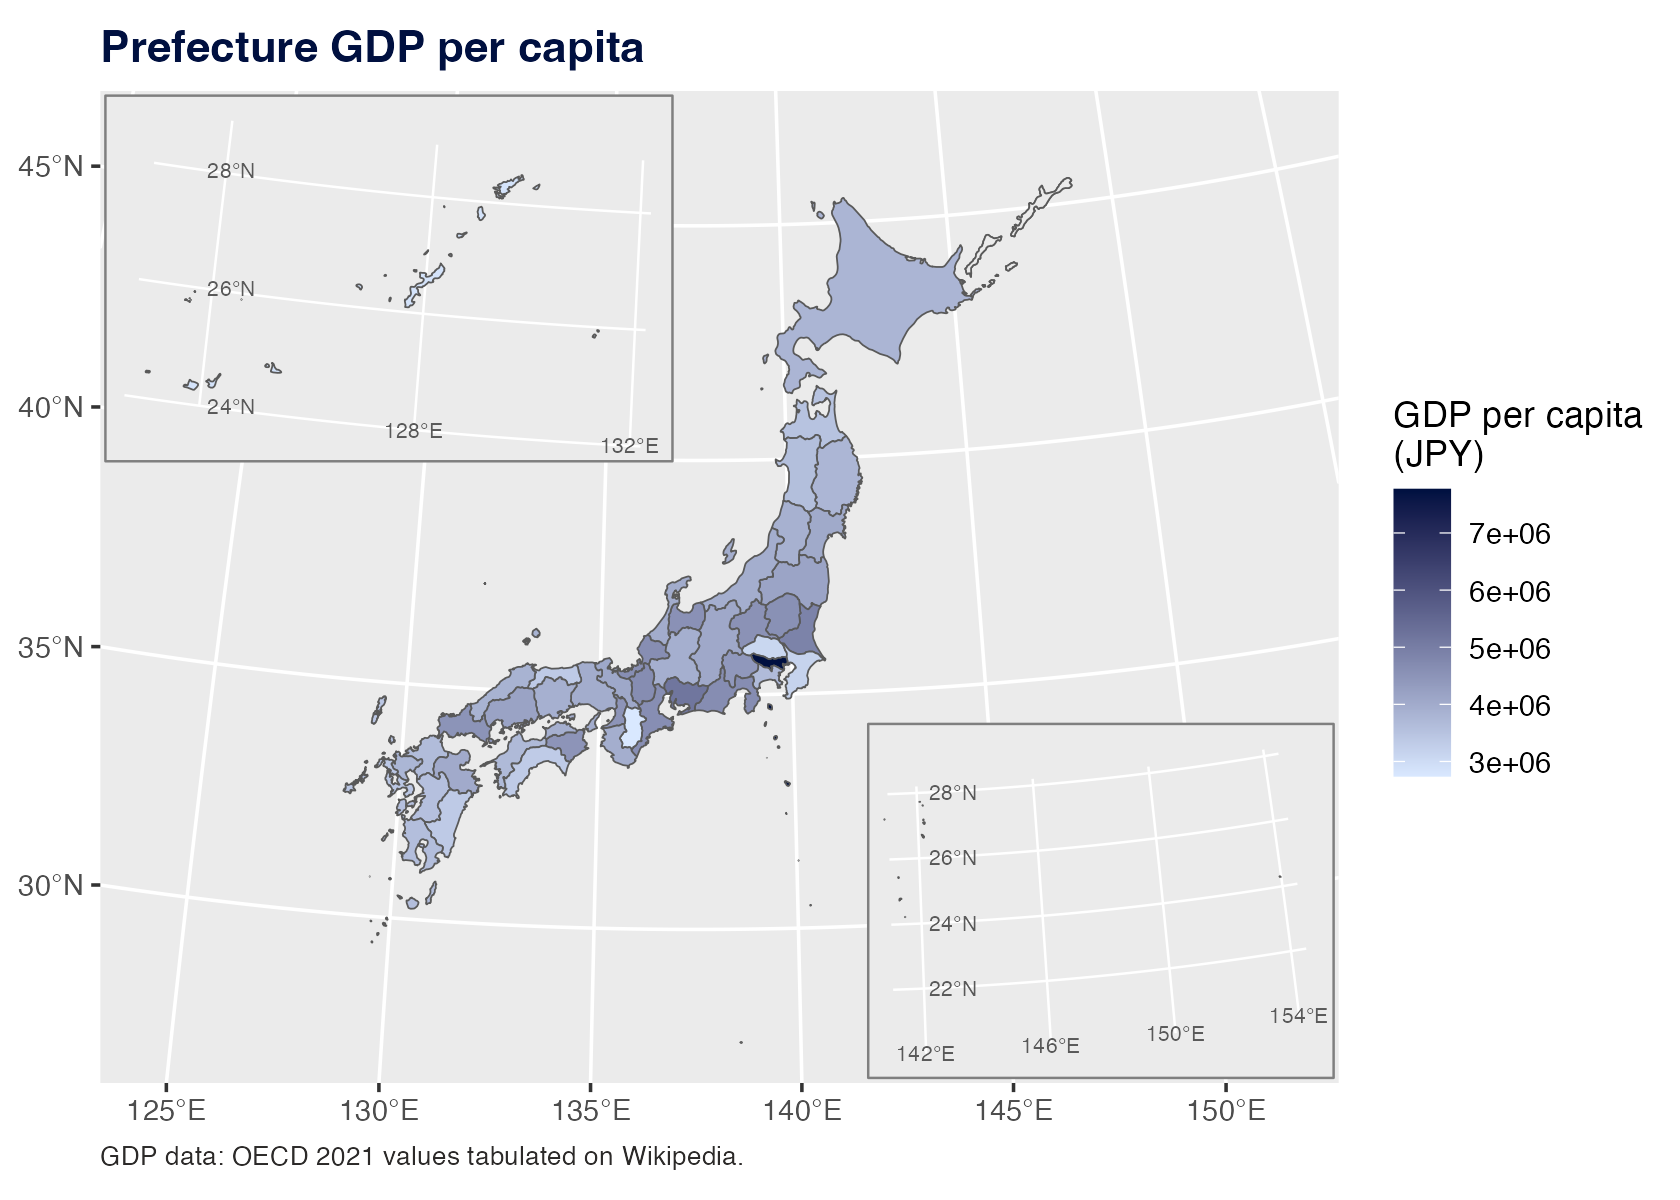
prefectural-choropleths.RmdThis example uses jp_prefecture_gdp, a bundled
prefecture-level GDP dataset. The map uses one fill variable: GDP per
capita in Japanese yen.
library(tidyverse)
library(jpmap)

gdp <- jp_prefecture_gdp |>
  select(pref_code, prefecture, gdp_per_capita_jpy)
plot_jpmap(
  "prefecture",
  data = gdp,
  values = "gdp_per_capita_jpy",
  color = "grey35",
  linewidth = 0.25
) +
  scale_fill_gradient(
    low = "#D9E8FF",
    high = "#001040",
    name = "GDP per capita\n(JPY)"
  ) +
  labs(
    title = "Prefecture GDP per capita",
    caption = "GDP data: OECD 2021 values tabulated on Wikipedia."
  ) +
  theme(
    legend.background = element_rect(fill = "white", color = NA),
    plot.title = element_text(face = "bold", color = "#001040"),
    plot.caption = element_text(color = "#2C2A29", hjust = 0, size = 8)
  )
plot_jpmap() joins by a shared column. Here both the map
and gdp have pref_code, so no extra join
argument is needed.